Google Analytics Overview
Google Analytics is a powerful tracking tool that allows you to monitor and track your visitors as they come to your website. It also allows you to view detailed reports of how your visitors behave, their demographics, and much more.
We will briefly talk about each major section of the Google Analytic control panel and its uses. If you want further information or how to sign up, you can use the links immediately below.
- Create a Google Analytics Account
- Google Analytics vs AWStats
- Access the tracking code for a site that is already setup in Google Analytics
Lets see how to add the tracking code to various softwares.
- Add Google Analytics to Drupal
- Add Google Analytics to Joomla
- Add Google Analytics to WordPress
- Add Google Analytics to HTML
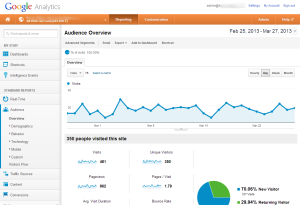
This is the main page of the Google Analytics panel. You can get most of the pertinent details you need for day to day operations from this page. You have access to a graph that shows you visitors over the last little bit as well as other great information such as unique visitors, page-views, new vs returning and more.
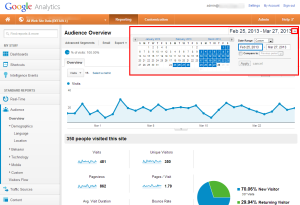
You can change the date rage by clicking the date dropdown menu located at the top right of the page. In fact, you can do this for any page!
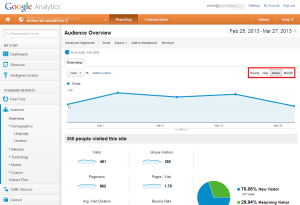
You can change the line graph to report in different increments, such as hourly, day, week and month. This can give you a better overview if you are printing out reports or want to see growth over, say, a year.
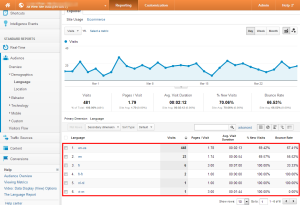
Audience > Demographics > Language
This section, you can see what languages people have set as default on their computer. This can be helpful if you are interested in translating all/part of your website into another language.
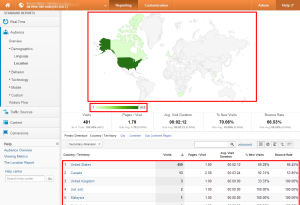
Audience >Demographics > Location
This is a very helpful section that allows you to see where your visitors reside in the world. You have a handy map that you can click on to dig deep into location information (all the way down to city view). You also have a general overview located below the map if you just want to see basic information.
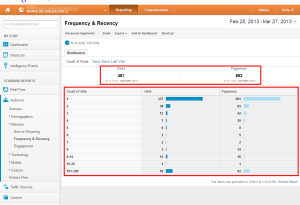
Audience > Behavior > Frequency & Recency
This section is helpful as it shows you how frequently your visitors return to your website. This section is just to give you a general idea of how many people return to your website.
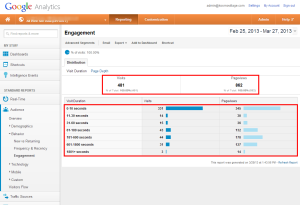
Audience > Behavior > Engagement
This section shows you a general overview of how long your visitors stay on your website.
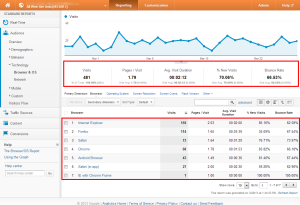
Audience > Technology > Browser & OS
This section allows you to see the the browsers (and versions) your visitors use when visiting your website. This information can be helpful if you have only developed/designed your website to be viewed by the the most common browsers. It allows you to see the other browsers being used so that you can test your own website using these browsers to ensure that everything works properly.
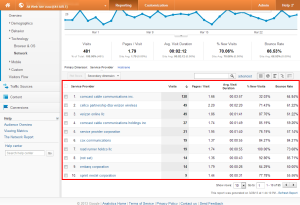
Audience > Technology > Network
This section is more for the network IT people. It allows you to see the network/internet provider people use when visiting your website.
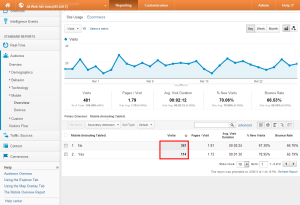
Audience > Mobile > Overview
This overview section shows you if your site is being used by mobile (cell phones and tablets) users. This type of information can be helpful in-case you want to design a mobile version of your website.
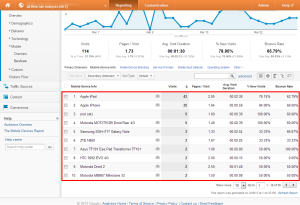
Audience > Mobile > Devices
In this section, you can see the primary devices people are using when they browse your site using mobile devices.
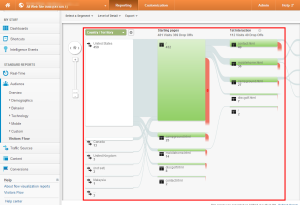
Audience > Visitor Flow
This section is very, very neat. It allows you to see where your visitors land (first page they visit) and where they go from there. On this screen shot, you can see that most (432) people land on the home page (/) and a majority go directly to the contact page (40 / contact.html). You can track this information all the way down until they leave the site (the red arrow pointing down).
Traffic Sources > Overview
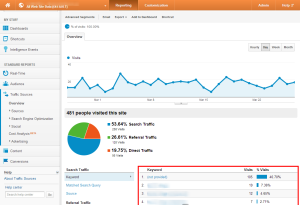
This is a great overview page! It allows you to see the keywords most used in search engines and also shows you the type of traffic you receive.
Traffic Sources > Sources > Referrals
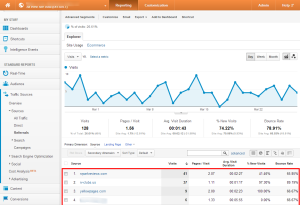
In this section, you can see what websites send people to your website and out of them, who sends the most traffic.
Content > Overview
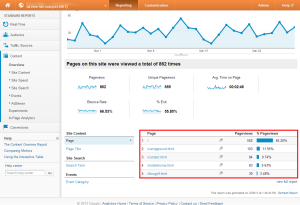
This section shows you the most viewed pages on your website. Remember, that in most situations, “/” represents your home page.
Content > Site Speed > Overview
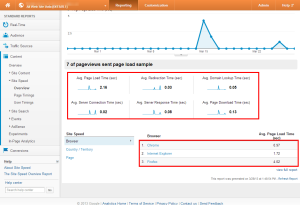
This section gives you a basic overview of how your site is preforming for your visitors. Remember, higher load times may cause visitors to leave before the site has been fully loaded, so this section can be very helpful to see how long things are taking and if you should tweak things.
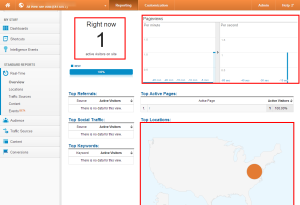
Real-Time
This is a newer feature of Google Analytics and is geared more towards the sites with a lot of traffic. It allows you to see real time stats of your site, and how many people are currently vising it. It also shows basic location information as well as a time graph to see the drop off rate over time.
This concludes our general overview article about Google Analytics. We have only touched the surface of the features that are available in this powerful software and we recommend that you look into setting it up on your own website so that you can get a better understanding of the information you are able to view.

