DNS: Network Tools
Throughout your hosting experience you may come across situations in which you find that your website doesn’t load for you but it does load for others.
When viewing other help articles or when you contact support you may be asked to perform a MTR, a PING, or a Trace route. These are tools that are designed to help you and the support team try to determine why this is the case. Explanations and guides for these tools are linked below.
A PING will send a packet of data from one computer to another to measure the time it takes for information to be sent and received. It is helpful for troubleshooting accessibility or performance issues you may be having or simply a quick way to tell if a host is “up” or performing slowly or intermittently performing poorly.
A Traceroute shows the route you take over the Internet to reach Site5’s servers. Information on what routers or back-bone providers you pass through can help Site5 diagnose a network problem.
- How to run a traceroute in Windows
- How to run a traceroute in Mac OS X
- How to run a traceroute in Unix/Linux
A MTR (Matts Trace Route) is an advanced version of a standard trace route that also measures packet loss between network hops. It is helpful when debugging slow sites, random connection issues, etc
FLUSH DNS – Your DNS cache stores the locations (IP addresses) of web servers that contain web pages which you have recently viewed. If the location of the web server changes before the entry in your DNS cache updates, you can no longer access the site.
How to run a ping in Windows
Click on the “Start” menu and type “cmd” into the search field (where it says “Search programs and files” or “Start search”).
Push the Enter key on your keyboard. A DOS prompt window will open up.
Type the following command in the command window: “ping yourdomain.com” (remember to replace yourdomain.com with the actual domain name you want to ping) and click the enter/return key on your keyboard
The output will look similar to the following:
C:\Users\User>ping -n 10 site5.com
Pinging site5.com [74.53.50.50] with 32 bytes of data:
Reply from 74.53.50.50: bytes=32 time=61ms TTL=128
Reply from 74.53.50.50: bytes=32 time=63ms TTL=128
Reply from 74.53.50.50: bytes=32 time=62ms TTL=128
Reply from 74.53.50.50: bytes=32 time=65ms TTL=128
Reply from 74.53.50.50: bytes=32 time=62ms TTL=128
Reply from 74.53.50.50: bytes=32 time=64ms TTL=128
Reply from 74.53.50.50: bytes=32 time=70ms TTL=128
Reply from 74.53.50.50: bytes=32 time=76ms TTL=128
Reply from 74.53.50.50: bytes=32 time=65ms TTL=128
Reply from 74.53.50.50: bytes=32 time=60ms TTL=128
Ping statistics for 74.53.50.50:
Packets: Sent = 10, Received = 10, Lost = 0 (0% loss),
Approximate round trip times in milli-seconds:
Minimum = 60ms, Maximum = 76ms, Average = 64ms
- You can copy and paste this into an email by selecting the upper-left hand icon and selecting “Edit -> Mark”
- You can now “select” the text of the window using your mouse cursor. Select the text of the results and hit “enter”. This will put the text on the clipboard.
- You can then use your keyboard and press Control + V to paste the results into any other Windows application, including your e-mail client or a text field in a web browser (in a Backstage ticket response).
How to run a ping in Mac OS X
- On Mac OS X, you will need to navigate to the spotlight and search for “Network Utility”
- Once the Network Utility is running, click on the “Ping” tab and specify a domain or IP address to check. The default of “Send only 10 pings” will be fine.
- Click on the “Ping” button to start the ping test.
- The output will look similar to the following:
Ping has started… PING site5.com (74.53.50.50): 56 data bytes 64 bytes from 74.53.50.50: icmp_seq=0 ttl=45 time=62.190 ms 64 bytes from 74.53.50.50: icmp_seq=1 ttl=45 time=64.969 ms 64 bytes from 74.53.50.50: icmp_seq=2 ttl=45 time=76.836 ms 64 bytes from 74.53.50.50: icmp_seq=3 ttl=45 time=61.060 ms 64 bytes from 74.53.50.50: icmp_seq=4 ttl=45 time=65.305 ms 64 bytes from 74.53.50.50: icmp_seq=5 ttl=45 time=63.224 ms 64 bytes from 74.53.50.50: icmp_seq=6 ttl=45 time=62.646 ms 64 bytes from 74.53.50.50: icmp_seq=7 ttl=45 time=71.861 ms 64 bytes from 74.53.50.50: icmp_seq=8 ttl=45 time=63.374 ms 64 bytes from 74.53.50.50: icmp_seq=9 ttl=45 time=63.060 ms --- site5.com ping statistics --- 10 packets transmitted, 10 packets received, 0.0% packet loss round-trip min/avg/max/stddev = 61.060/65.453/76.836/4.730 ms |
- You can copy and paste this into an email by selecting the text and selecting “Edit -> Copy”
- You can then use your keyboard and press ⌘ V to paste the results into any other OS X application, including your e-mail client or a text field in a web browser (in a Backstage ticket response).
How to run a ping in Unix/Linux
- *NIX or Linux users can ping a domain or IP by opening a terminal window. Consult your window manager (Gnome, KDE, etc.) documentation if you are unsure how to do this.
- Next, you will need to type in “ping -t 10 yourdomain.com” or “ping -t 10 IP Address” (replacing the IP address or domain name with the domain/IP you would like to test).
- Now, press the enter button on your keyboard to see the ping results.
- The output will look similar to the following:
# ping -t 10 site5.com PING site5.com (74.53.50.50): 56 data bytes 64 bytes from 74.53.50.50: icmp_seq=0 ttl=45 time=62.144 ms 64 bytes from 74.53.50.50: icmp_seq=1 ttl=45 time=62.141 ms 64 bytes from 74.53.50.50: icmp_seq=2 ttl=45 time=68.601 ms 64 bytes from 74.53.50.50: icmp_seq=3 ttl=45 time=62.239 ms 64 bytes from 74.53.50.50: icmp_seq=4 ttl=45 time=61.987 ms 64 bytes from 74.53.50.50: icmp_seq=5 ttl=45 time=60.840 ms 64 bytes from 74.53.50.50: icmp_seq=6 ttl=45 time=66.491 ms 64 bytes from 74.53.50.50: icmp_seq=7 ttl=45 time=68.235 ms 64 bytes from 74.53.50.50: icmp_seq=8 ttl=45 time=72.815 ms 64 bytes from 74.53.50.50: icmp_seq=9 ttl=45 time=67.982 ms --- site5.com ping statistics --- 10 packets transmitted, 10 packets received, 0.0% packet loss round-trip min/avg/max/stddev = 60.840/65.347/72.815/3.805 ms |
- You can copy and paste this into an email by selecting the text and pressing CTRL + C”
- You can then use your keyboard and press CTRL + V to paste the results into any other *nix application, including your e-mail client or a text field in a web browser (in a Backstage ticket response).
How to run a trace route in Windows
- Click on the “Start” menu and type “cmd” into the search field (where it says “Search programs and files” or “Start search”).
- Push the Enter key on your keyboard. A DOS prompt window will open up.
- Type the following command in the command window: “tracert -d yourdomain.com” (remember to replace yourdomain.com with your actual domain name)
Make sure to let the traceroute finish completely; it can sometimes take several minutes.
- You should see something similar to the following when it finishes:


C:\Users\Account tracert -d yourdomain.com

Tracing route to yourdomain.com [74.53.50.50]
over a maximum of 30 hops:

  1     1 ms    <1 ms    <1 ms  192.168.1.1
  2    29 ms    22 ms    28 ms  11.207.112.1
  3    19 ms    14 ms    11 ms  88.25.44.69
  4    12 ms    12 ms    27 ms  88.25.52.33
  5    14 ms    11 ms    10 ms  88.25.52.29
  6    13 ms     9 ms    13 ms  88.25.52.25
  7    11 ms    12 ms    12 ms  88.25.52.21
  8    14 ms    12 ms    13 ms  88.55.41.181
  9    12 ms    19 ms    13 ms  88.55.41.253
 10    14 ms    26 ms    14 ms  79.139.195.145
 11    26 ms    27 ms    27 ms  79.139.194.249
 12    45 ms    42 ms    44 ms  98.86.94.161
 13    49 ms    50 ms    51 ms  98.86.87.82
 14    70 ms    69 ms    70 ms  98.86.85.153
 15    75 ms    81 ms    71 ms  98.86.85.34
 16    68 ms    69 ms    66 ms  75.149.228.2
 17    77 ms    71 ms    79 ms  70.87.253.2
 18    68 ms    69 ms    72 ms  70.87.255.66
 19    72 ms    68 ms    70 ms  70.87.254.186
 20    84 ms    68 ms    71 ms  74.53.50.50

Trace complete.

C:\Users\Account
- You can copy and paste this into an email by selecting the upper-left hand icon and selecting “Edit -> Mark”
- You can now “select” the text of the window using your mouse cursor. Select the text of the results and hit “enter”. This will put the text on the clipboard. You can then use your keyboard and press Control + V to paste the results into any other Windows application, including your e-mail client or a text field in a web browser (in a Backstage ticket response).
How to run a trace route in OS X
- On Mac OS X, you will need to navigate to the spotlight and search for “Network Utility”
- Once the Network Utility is running, click on the “Ping” tab and specify a domain or IP address to check. The default of “Send only 10 pings” will be fine.
- Click on the “Traceroute” button to start the traceroute test.
- The output will look similar to the following:
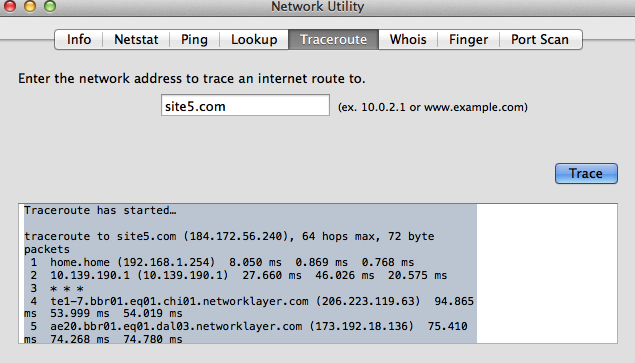
Traceroute has started…
traceroute to site5.com (184.172.56.240), 64 hops max, 72 byte packets
1 home.home (192.168.1.254) 8.050 ms 0.869 ms 0.768 ms
2 10.139.190.1 (10.139.190.1) 27.660 ms 46.026 ms 20.575 ms
3 * * *
4 te1-7.bbr01.eq01.chi01.networklayer.com (206.223.119.63) 94.865 ms 53.999 ms 54.019 ms
5 ae20.bbr01.eq01.dal03.networklayer.com (173.192.18.136) 75.410 ms 74.268 ms 74.780 ms
6 po1.npr01.eq01.dal03.networklayer.com (75.126.61.251) 74.865 ms * 74.579 ms
7 * * *
8 75.126.61.172-static.reverse.softlayer.com (75.126.61.172) 76.664 ms 76.035 ms 75.819 ms
9 po1.fcr01.sr01.dal05.networklayer.com (173.192.118.131) 77.319 ms 106.651 ms 73.981 ms
10 184.172.56.240-static.reverse.softlayer.com (184.172.56.240) 74.330 ms 75.072 ms 74.187 ms
- You can copy and paste this into an email by selecting the text and selecting “Edit -> Copy”
- You can then use your keyboard and press ⌘ V to paste the results into any other OS X application, including your e-mail client or a text field in a web browser (in a Backstage ticket response).
How to run a Trace in Unix/Linux
- Open up your terminal application (how you do this depends on if you’re using a window manager like KDE or Gnome).
- In the terminal window, type the following command: “traceroute -n yourdomain.com”. (remember to replace yourdomain.com with your actual domain name).
Make sure to let the traceroute finish completely; it can sometimes take several minutes. You should see something similar to the following when it finishes: 
penguin@my-linux-computer [~]# traceroute -n yourdomain.com
traceroute to yourdomain.com (74.53.50.50), 30 hops max, 40 byte packets
 1  184.154.151.65  5.118 ms  5.387 ms  5.626 ms
 2  173.236.77.85  0.430 ms  0.708 ms  0.705 ms
 3  64.124.146.113  1.415 ms  1.789 ms  1.786 ms
 4  64.125.31.198  1.776 ms  1.767 ms  1.755 ms
 5  64.125.30.61  57.229 ms  57.219 ms  57.205 ms
 6  64.125.26.210  26.855 ms  26.770 ms  26.770 ms
 7  64.125.199.94  31.767 ms  31.489 ms  31.279 ms
 8  70.87.253.6  114.388 ms 70.87.253.90  26.795 ms 70.87.253.18  27.107 ms
 9  70.87.253.114  27.100 ms 70.87.255.122  27.480 ms 70.87.255.130  27.216 ms
10  70.87.254.190  27.350 ms  27.321 ms  27.502 ms
11  74.53.50.50  27.005 ms  27.253 ms  27.267 ms
penguin@my-linux-computer [~]#
- You can copy and paste this into an email by selecting the text and pressing CTRL + C”
- You can then use your keyboard and press CTRL + V to paste the results into any other *nix application, including your e-mail client or a text field in a web browser (in a Backstage ticket response).
How to run a MTR in Windows
You can download WinMTR by clicking here.
Below we will cover basic use of WinMTR.
1) Open WinMTR
2) Enter the server name or IP address of your server, or the server you wish to check.

3) Click the Start button

3) You can copy the data to your clipboard at anytime by clicking Copy Text to clipboard. You could then paste it into an email or ticket for tech support to review.

If you wish to see more information about a certain hop, double click on the hostname to show the host properties window.

Below we will cover what each column of the results mean…
- Hostname
- This is the hostname of the hop.
- Nr
- This shows you the hop number.
- Loss
- This shows you the percentage of the pings that have been lost compared to received.
- Sent
- This shows you the total pings that have been attempted.
- Recv
- This shows you the number of suspenseful pings that have been received.
- Best
- This shows you the best ping response time out of all the attempts.
- Avrg
- This shows you the average response time of the ping attempts.
- Worst
- This shows you the worst response time of all the ping attempts.
- Last
- This shows you the response time of the last ping attempt
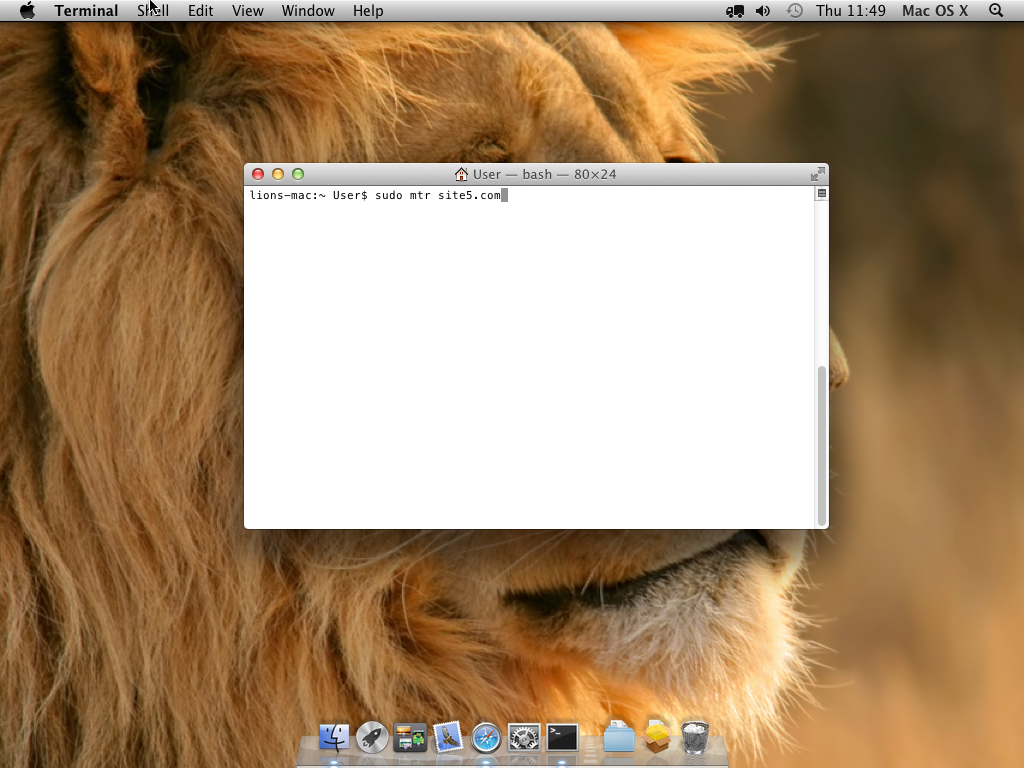
How to run a MTR in Mac OS X
If you have not already installed MTR, you can get a self installer here.
1) Open a terminal
2) Enter the following command:
sudo /usr/local/sbin/mtr -r example.com |
Please note, you may be asked to enter your password for your Mac. This is normal.
Where example.com would be replaced with the server host, ip address or the domain of the site you wish to check.
This will take a few moments to complete (max of 60 seconds).

How to run a MTR in Unix/Linux
1) Open a Terminal
2) Enter the following command.
mtr -r example.com |
Where example.com would be replaced with the server host, ip address or the domain of the site you wish to check.

This will take a few moments to complete (max of 60 seconds).

3) You can copy the data to your clipboard by selecting the information and then right clicking and selecting Copy. You could then paste it into an email or ticket for tech support to review.

That’s it!
Below we will cover what each column of the results mean…
- Host
- This is the hostname of the hop.
- Loss
- This shows you the percentage of the pings that have been lost compared to received.
- Snt
- This shows you the total pings that have been attempted.
- Last
- This shows you the response time of the last ping attempt
- Avg
- This shows you the average response time of the ping attempts.
- Best
- This shows you the best ping response time out of all the attempts.
- Worst
- This shows you the worst response time of all the ping attempts.
- StDev
-
- This shows you the amount of deviation between ping requests.
In the event that you wish to use WINDOWS to Flush DNS, follow steps below.
Flush DNS in Windows
You will need to open a command window. Click Start, select Run, then type “cmd” On Vista/7 just type “cmd” into the search box and hit Enter. At the prompt enter the following command:
ipconfig /flushdns

In the event that you wish to use OS X to Flush DNS, follow steps below.
Flush DNS in OS X
To flush and reset all DNS caches, launch Terminal app and type a command from below based on the version of the Mac OS X you are presently running. (Apple > About This Mac)
OS X 10.10 (Yosemite)
Target both MDNS (Multicast DNS) and UDNS (Unicast DNS) with the one command:
sudo discoveryutil mdnsflushcache;sudo discoveryutil udnsflushcaches;say flushed
OS X 10.7 – v10.9 (Mavericks, Mountain Lion, and Lion)
sudo killall -HUP mDNSResponder
OS X v10.5 and v10.6 (Leopard and Snow Leopard)
sudo dscacheutil -flushcache
OS X 10.4 (Tiger) or lower:
lookupd -flushcache
In the event that you wish to use LINUX to Flush DNS, follow steps below.
Flush DNS in Unix/Linux
Open a shell session and type the following:
sudo /etc/init.d/nscd restart
